Site Tour Video

Firstly, kick back and enjoy our site tour video as we welcome you to My House Stats.
To begin, My House Stats is your online real estate agent ready to give you the stats on different neighbourhoods in North America. In addition, we will teach you how each differs in price, size, number of beds and baths, and more. Moreover, you can find the average house price in your desired neighbourhood or city.
Background – Site Tour Video
What will be covered:
- how the site helps you
- using the homepage
- getting your estimate
- playing with interactive data
- climbing the leader board
How the Site Helps You
Firstly, you’ll find the average house price in your desired neighbourhood. Moreover, you’ll see the square footage of houses in different neighbourhoods. In addition, you can figure out which cities are best to buy in. Likewise, investors can also use this knowledge.
The Home Page
Most importantly, the home page is simple. You can compare your house and see recent home value estimates by other users. To compare, simply register, sign in, enter your house stats, then compare. As a result, this shows you how your stats compare to your neighborhood, city, state/province, and country.
Playing with Interactive Data
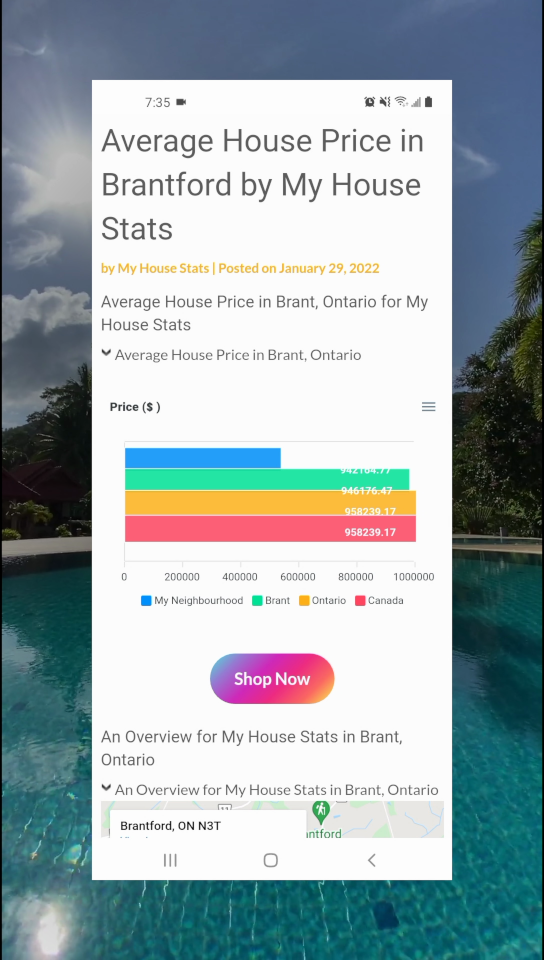
Consequently, after you click compare, you are presented with data visualizations of each neighbourhood’s housing stats. Moreover, you have the power to play with and manipulate the data is presented. Finally, you can save the different charts as images to share with friends.
The Leader Board
Most importantly, only the most elite users land on the leader board. However, that doesn’t stop you from climbing. Likewise, easy ways of achieving number one on the leader board is by doing the following:
- submitting your comparisons
- friends and family
- interacting with other users through comments
Summary – Site Tour Video
Finally, the video will show you the steps we covered in this article. in conclusion, enjoy the video.
Leave us a review on Google.


